Reports are how CattleIQ turns your records into operational views.
Filter to the animals you're thinking about, choose the columns and charts that matter, save the configuration, and come back to it any time. The data in a saved report is always live, so it reflects whatever's true in your herd today.
In this guide we'll build a "New Calves" report as an example of a custom report an operation might want to replace their traditional calf book. It'll show all calves born this season and included charts for sex breakdown, death/loss, and brand.
The Reports overview
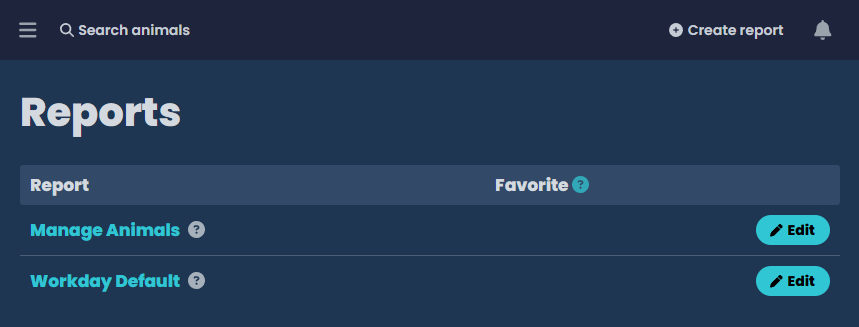
Click Reports in the main menu. The overview lists every report on the account with two built-in reports always present:
- Animals: powers the main animals view shown when you click Animals in the menu.
- Workday: powers the Worked Animals tab on every workday.
You can configure built-in reports the same way as custom ones, but you can't delete them.
Creating a report
On the overview, click Create report in the navbar page tasks to start creating a new report.
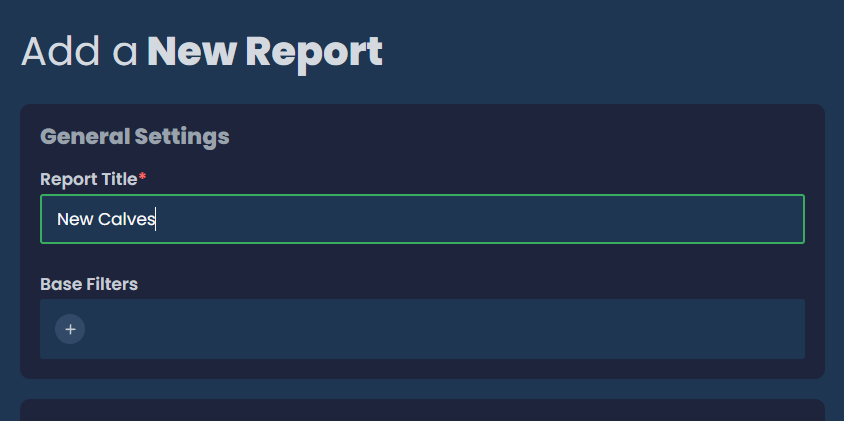
Report Title
The Report Title is how the report is named in the overview, in the menu when favorited, and at the top of the report page. For our example, we set Report Title to "New Calves".
Favorite
Toggling the Favorite checkbox adds this report to the main menu directly under Reports. Toggle this on for reports your team is accessing regularly each season. You can easily update your favorites directly from the reports overview.
For our example, we'll mark this report as a favorite so we can access it with one touch from the main menu during calving season.
Base filters
Base filters define the base set of animals that should be used for the report. You build them with a query builder that supports any field on the animal record. You can build queries that are quite powerful and complex, with a combination of several AND and OR filter clauses.
Base filters are fixed. Anyone viewing this report sees the same starting set of animals, and the filters can't be adjusted from the report view itself. For filters that viewers should be able to toggle, see Exposed filters below.
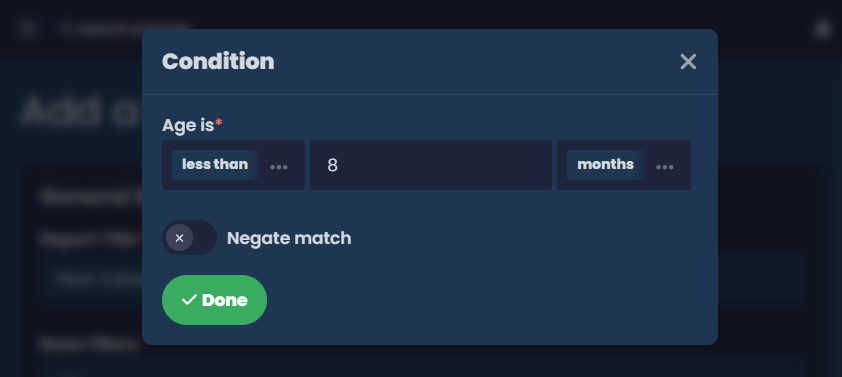
Our base filter is just Age under 8 months. We deliberately leave Status out because death and loss tracking matters to us, and the chart needs deceased calves in the data.
Report table
These settings control how the result data is shown.
Columns
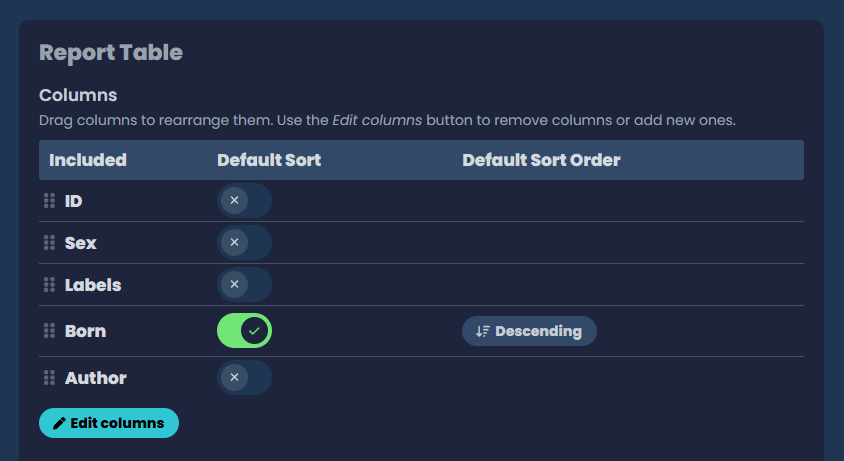
Click Edit columns to open the column picker. Search the available columns, click to add, and drag the rows in the table to reorder. Each column is a field on the animal record, plus a handful of calculated metrics that compute relative to the rest of your herd:
- Weight Gain: gain rate over time, with a small trend indicator versus the herd average.
- Calf Weight: average calf weight produced by this animal, also with a herd-average trend.
- Bred Status and Bred To: derived from the animal's reproductive history.
If genetics is enabled (see Genetics), you'll also see genetics-specific columns.
Set one column as the Default Sort and pick ascending or descending. Anyone viewing the report can override the sort, but this is what they'll see first.
For our example, the columns are ID, Sex, Labels, Born (how long ago they were born), and Author. The Author column shows who entered the record, useful when several of us are working calves on a given day. We set the default sort to Born descending so we see the newest calves at the top of the results.
Exposed filters
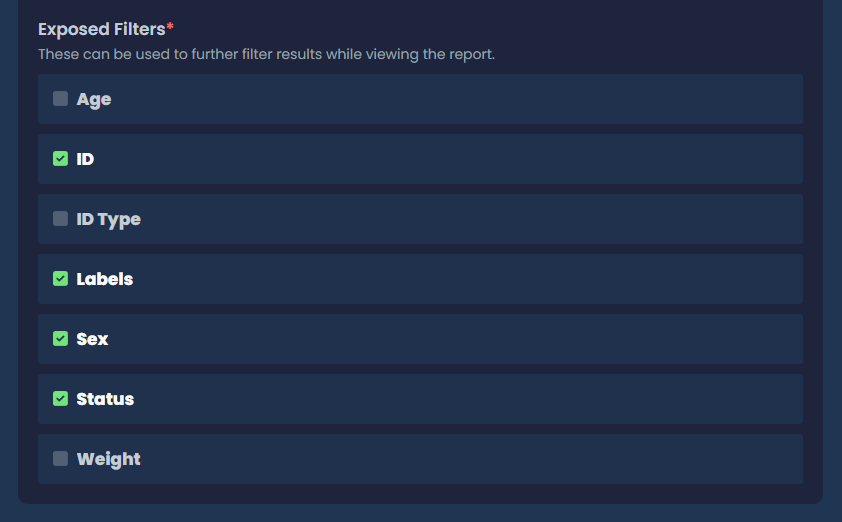
Exposed filters are an extra layer of filtering, configured by the builder but applied by the viewer when they open the report. Available exposed filter options are Age, ID, ID Type, Labels, Classification (sex), Status, and Weight. Pick which ones to expose; they show up on the Filters card on the report view.
For our example, we expose ID, Labels, Classification (sex), and Status.
Charts
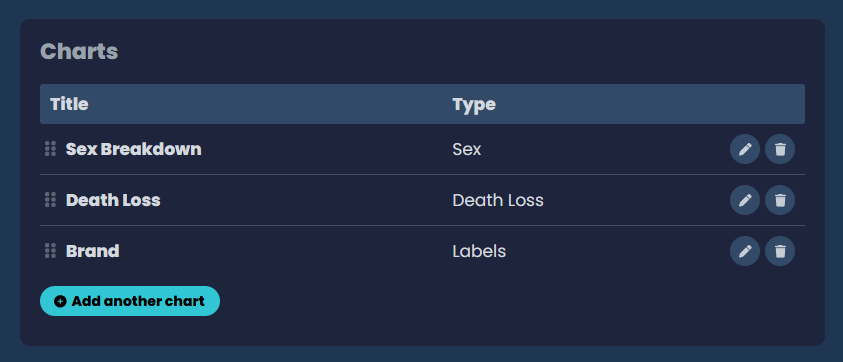
Charts allow you to see aggregated info about your result set at the top of the report table. Click Add chart to pick a chart type from the searchable list, give it a title, and configure any chart-specific options.
A report can have multiple charts. Drag them in the chart configuration table to reorder how they appear.
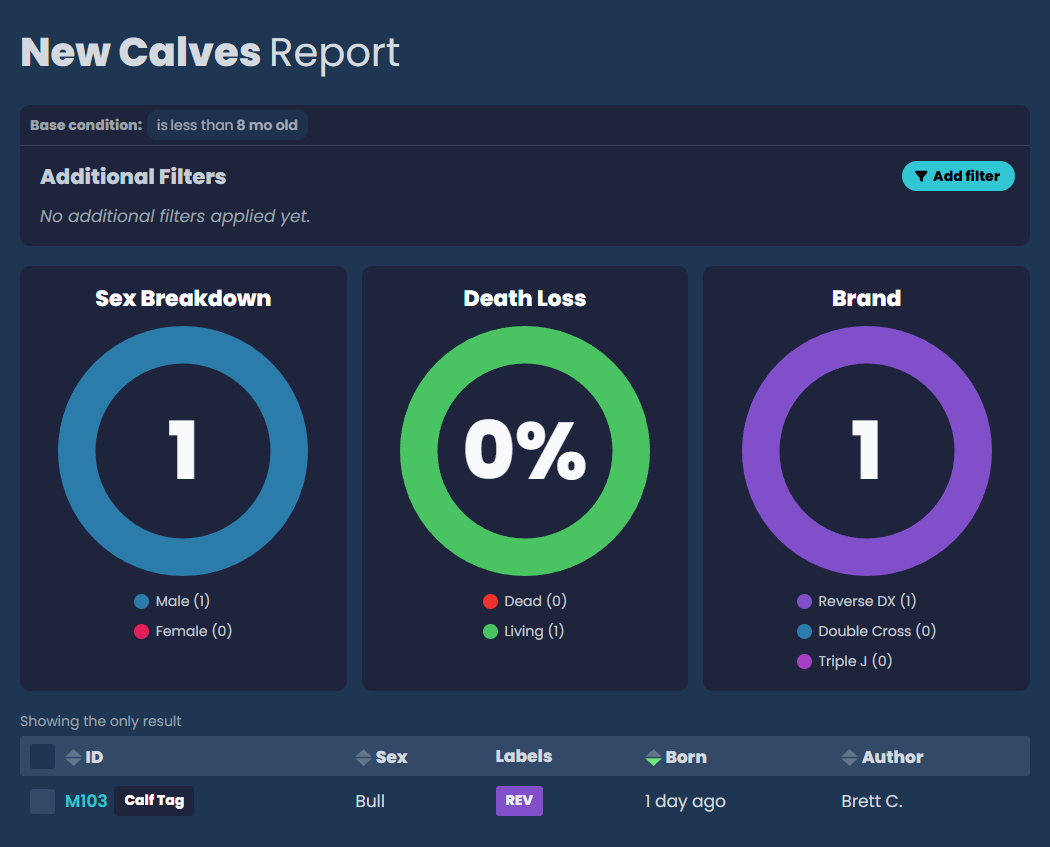
For our example, we'll add three. A Sex Breakdown for the heifer-to-bull ratio in this year's calf crop. A Death Loss chart to track what we've lost. And a Brands breakdown, since our operation co-maintains calves under different brands.
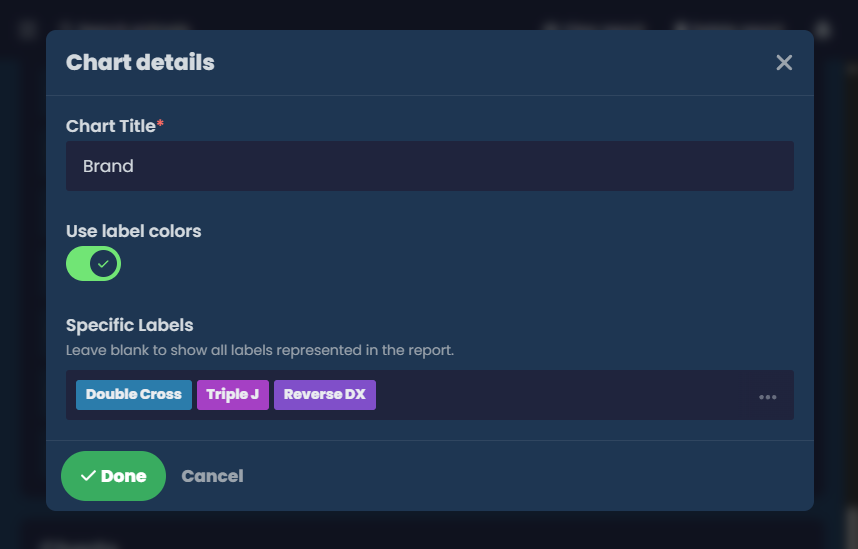
In our operation, we use labels to track brands/ownership. In this example, we build a Labels type chart, set the title to Brand, and choose our specific brand labels to be included.
Saving
Click Save and you're taken to the new report. The report shows up in the overview immediately, and under Reports in the main menu if it's favorited.
You can edit the report at any time by choosing Edit report in its page actions. There's no versioning. Saving overwrites the last saved configuration.
Reports are account-level. Anyone on your account can see and use any report.
Viewing a report
When you open a report, the the base filters and default sort are already applied. From here:
- Exposed filters live on the Filters card. Pick the ones you want, click Search to apply, Reset to clear. Your selections are remembered per report on this device.
- Sort by clicking any sortable column header.
- Live data: the report reflects current data. If something changes while you're looking, the app shows a "Some data changed" alert and offers to refresh.
In our example, we start seeing new information show up in our New Calves report as soon as they're entered.
Bulk updates from a report
The Bulk update page action offers a handy way to make sweeping updates to a set of animals, either to the report result set as a whole, or a manually selected subset. Available operations include:
- Label: add or remove labels.
- Status: change animal status.
- Bred, Pregnancy Check, Sale, Death: record events across the group.
Bulk updates run as a wizard that confirms what's about to change before committing. Useful for end-of-workday cleanup, ranch-wide season transitions, or anything where the same change applies to a group.
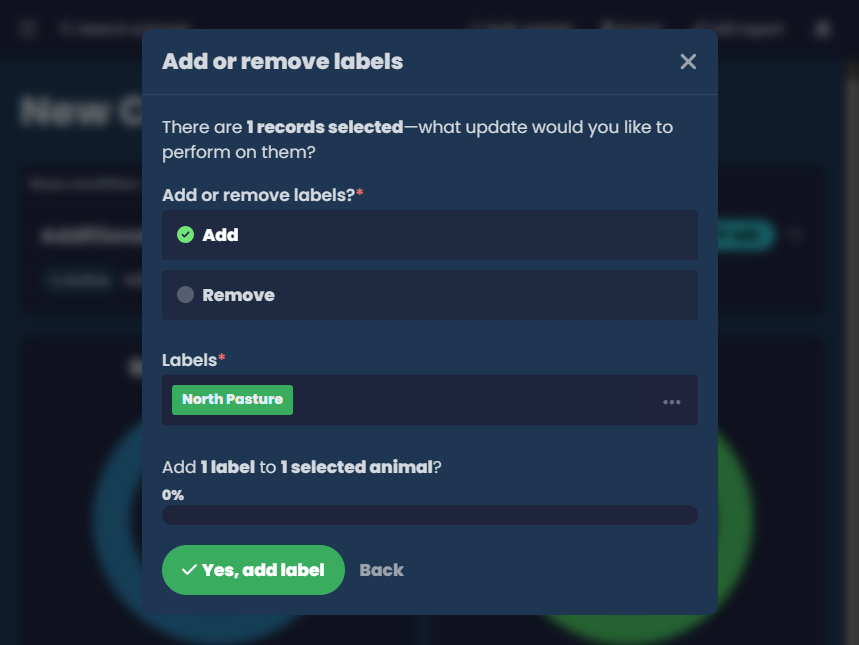
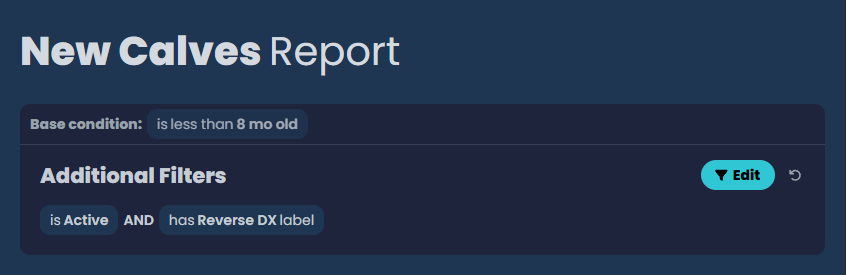
Let's imagine a scenario where we cut all calves with our Reverse DX ranch brand into the north pasture. From our calf report, we can use the exposed filters to show only living calves with our Reverse DX label.
With that done, we can choose Bulk update from the report page actions, choose the Add or remove labels option, and then add our North Pasture label to all the current report result animals.